GPU's are difficult to stress test. Unlike CPUs or RAM, they are often the only component in a PC that is not designed to work at 100% load. As graphics hardware evolves with increasingly dynamic power and frequency behavior, traditional full-load tests no longer reflect real usage nor reliably expose stability issues.
Why Modern GPUs Are Hard to Stress Test
Unlike CPUs and RAM, which can be stressed safely at 100% for quick stability detection, GPUs are not designed to run at maximum load. In gaming, the workload is highly dynamic and typically averages around 50% real utilization.
Why? Because of the CPU-GPU dependency loop. Playing a game involves both components, it's a fifty-fifty between the CPU and the GPU. The CPU handles game logic, object positions, inputs, sound and world state, while the GPU renders textures, meshes, shaders, effects, and the final frame. Both wait for each other during this process.
Because of this constant interplay, GPUs never really reach their absolute maximum power draw during real gameplay. Manufacturers eventually optimized designs around this reality: peak clock speeds now occur at medium load (40% to 60%), instead of at 100%.
This results in an efficiency curve where lower load equals higher clocks, while higher load produces lower clocks. Crucially, following this logic, many GPUs are stable under 100% load but unstable at their peak-frequency mid-load states.
It's a very complex scenario and it needed a novel approach.
Why Traditional Testing Doesn't Work (Anymore)
Traditionally, classic GPU stress tests force the card to full power instantly. But this approach no longer reflects real life conditions, because if the GPU is pushed to 100%, then it’s not operating at its max clock speed. A stress test pushing your GPU to 100% might display no error, but you could encounter an error at 50%.
For example, comparing OCCT's 3D Adaptive test with a FurMark test on a RTX4070 Ti shows that FurMark locks to max power instantly, while OCCT gradually ramps up. It also shows that OCCT reaches higher peak clocks because the load is lighter and more realistic. We can also see that OCCT exercises a wider range of voltage levels.
This exposes instability FurMark simply cannot detect, and this is why OCCT is using variable loads.
OCCT's Solution: 3D Adaptive and Variable Mode
How do we solve that problem? By trying to replicate a maximum of different loads and scenarios. That's what OCCT does with 3D Adaptive: a 3D test that can change its load dynamically. With a single click, you can run a short yet effective 3D test that will also hit instability zones between 40% and 60% intensity.
You can also replicate rapid spikes between intensities using OCCT's Switch mode (to illustrate, this could reproduce the load happening when switching between menus, windows, games, tasks, etc). This is what we call transient testing, it's extremely demanding on GPU power delivery and can expose issues you wouldn't see with a traditional stress test.
Testing Multiple GPUs at Once
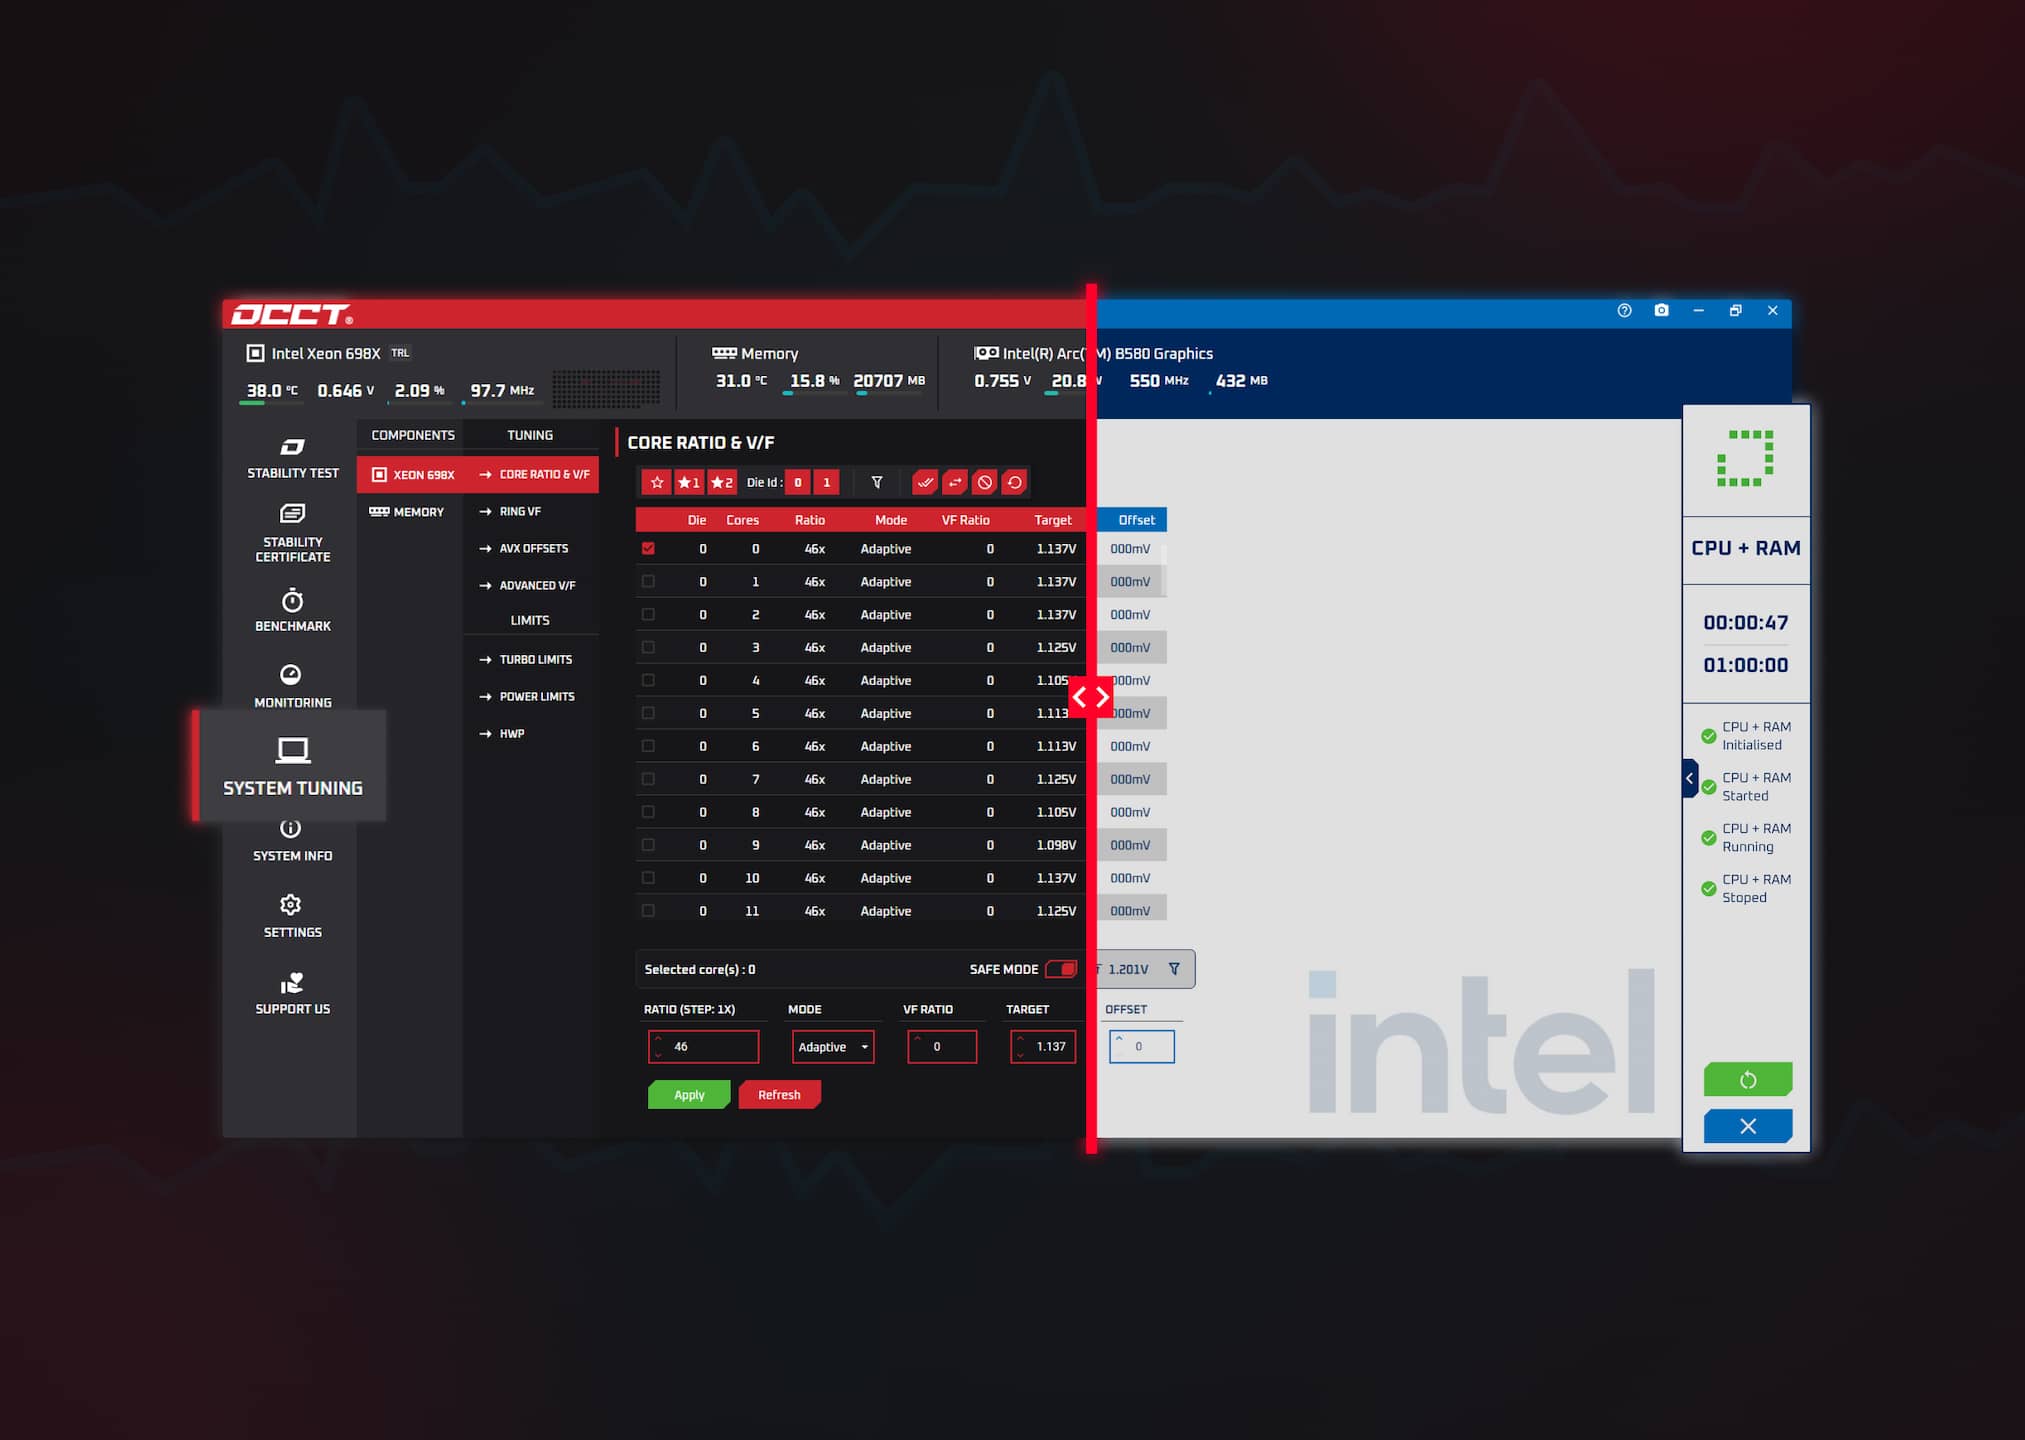
OCCT can also test multiple graphics cards of different brands at the same time, without the need for external displays. Here is an example of a system using a NVIDIA GPU, an AMD GPU, and an Intel GPU:
This is ideal for AI workstations, compute servers, mining rigs, multi-GPU rendering systems, etc. And just a single click starts the test across the entire machine.
What's New in OCCT v15: a Comparison with v14
OCCT v15 significantly improves the adaptive algorithm, especially for consistent behavior across GPUs from different brands.
Using the Enterprise edition's reporting and comparison tools, we can illustrate the improvements by comparing OCCT v14 vs. v15.
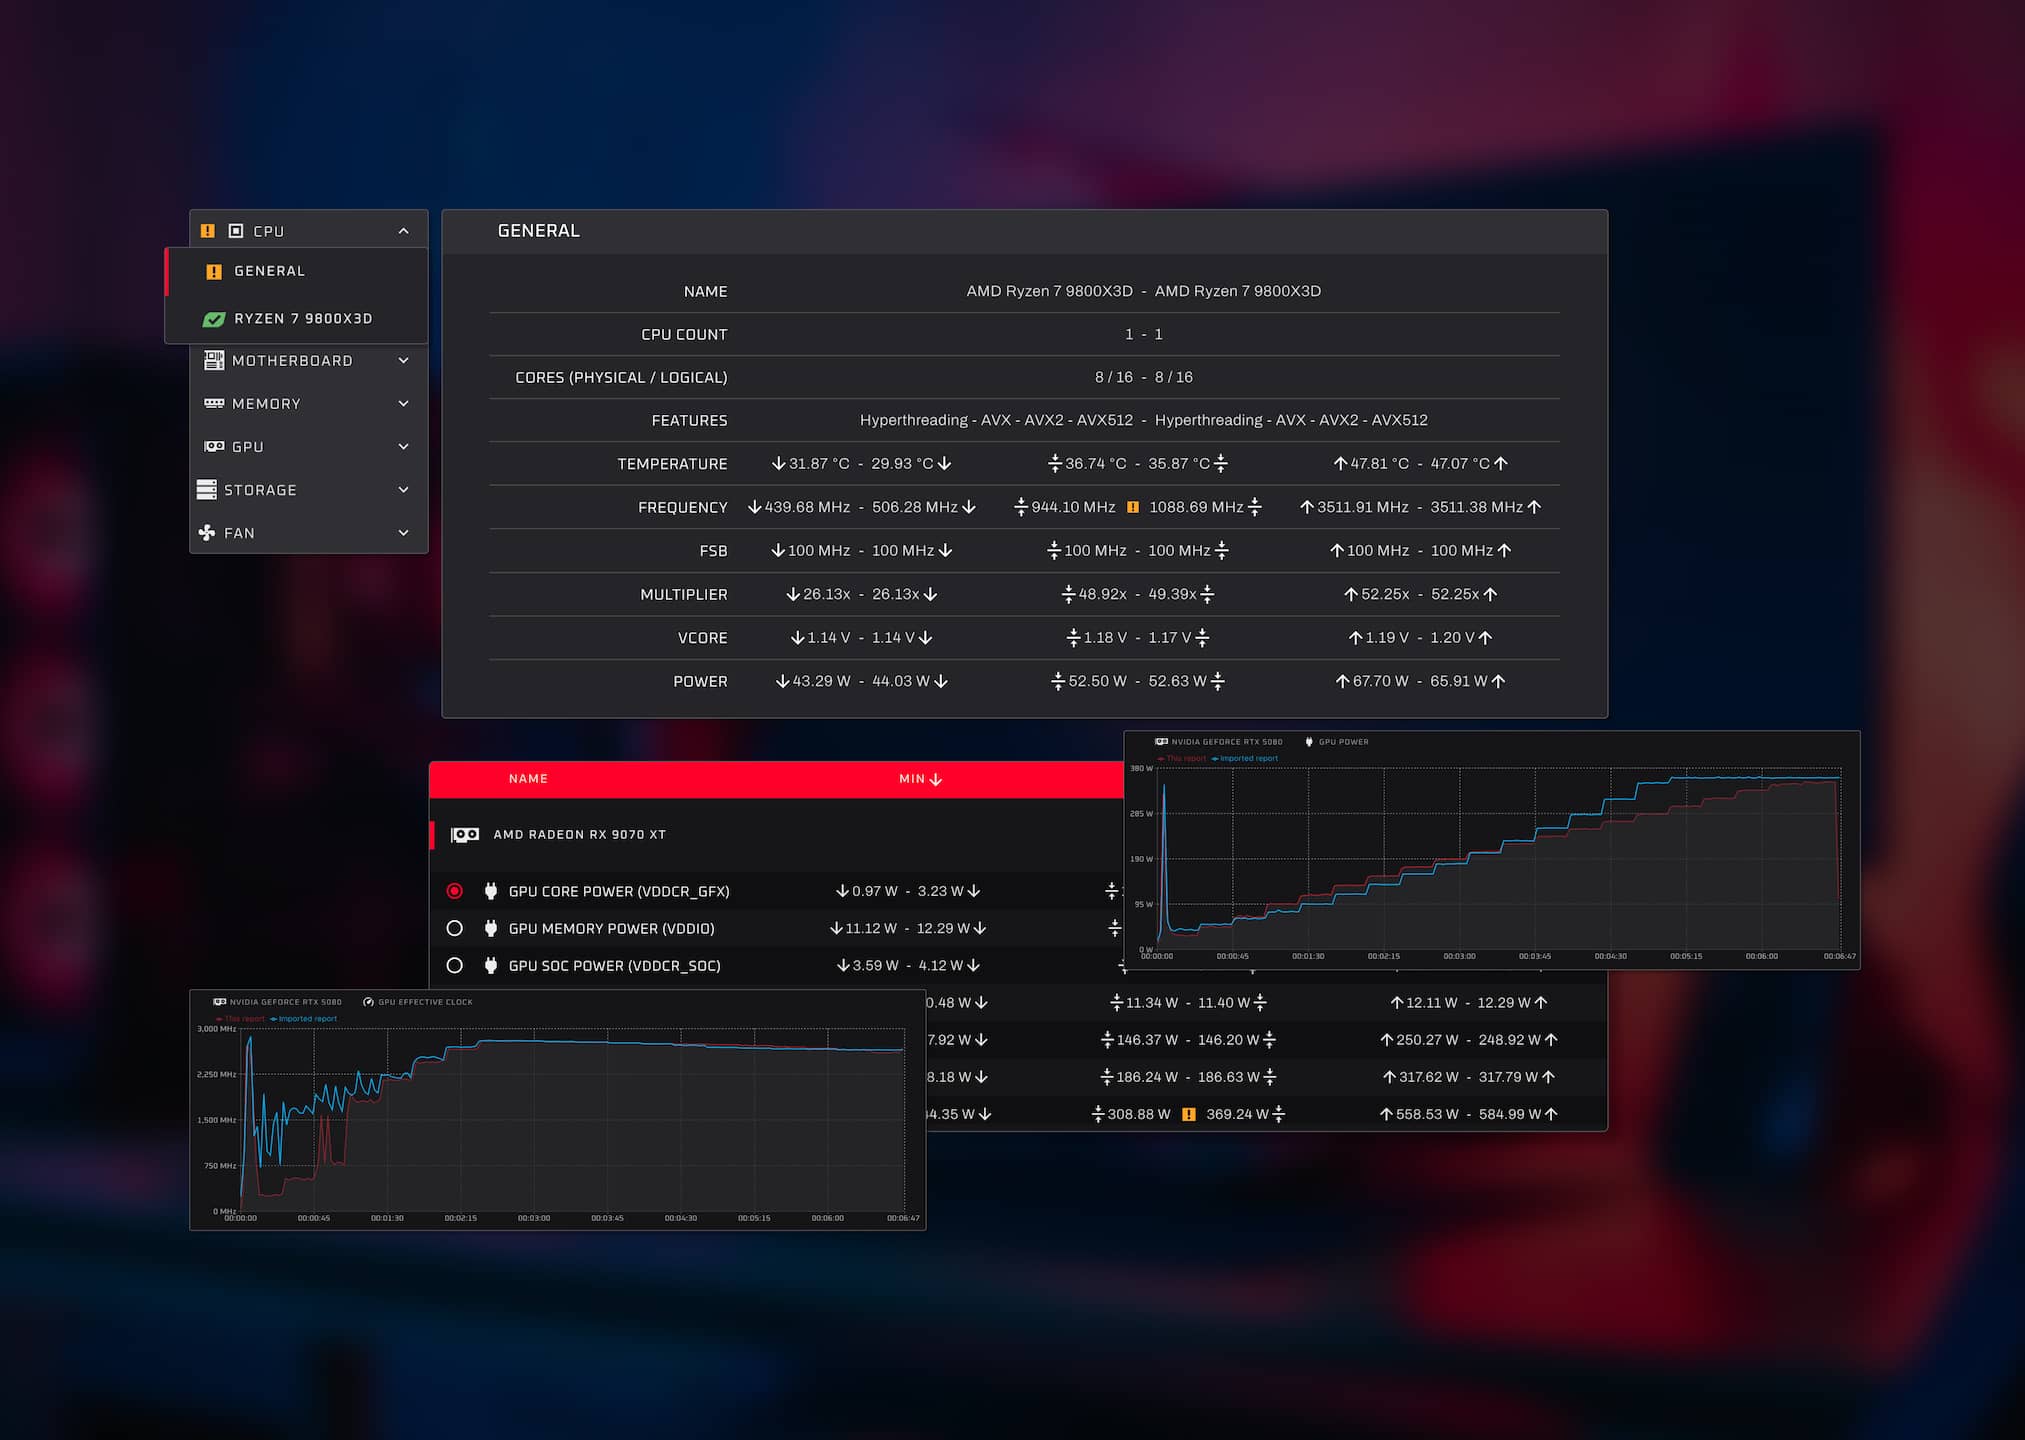
In this example, we're testing an NVIDIA RTX 5080 using OCCT Variable mode, increasing the intensity by 5% every 20 seconds. It's important to emphasize intensity because it doesn't automatically translate to the load reported by your driver.
In red is the curve for the new test in OCCT v15, and the blue is OCCT v14.
We can see the power curve on OCCT v15 is much smoother, and scales lower than v14.
Now onto the GPU clock curves for the same setup.
We can see that the clock curve peaks faster at mid-load (40% to 60%), and OCCT v15 is reading much lower clocks in the early part of the curve. Testing at lower clock has its use as well. Typically, you exit a game and your PC crashes. OCCT just got better at detecting that too.
These comparisons show how v15 aligns testing closer to real behavior instead of synthetic extremes.
Thank you for your continued support. We're committed to advancing stress testing, and we have plenty of new improvements, features, and insights on the way. Stay tuned, more is coming soon!